
Tenant Satisfaction Measures 2025/26
Listening to tenants, benchmarking our performance and acting on what we hear
SHOUT TMO is pleased to publish its 2025/26 Tenant Satisfaction Measures (TSM) results.
Tenant Satisfaction Measures were introduced by the Regulator of Social Housing to help tenants scrutinise landlord performance, improve transparency and help landlords identify where services need to improve.
Regulator of Social Housing — Tenant Satisfaction Measures:
https://www.gov.uk/government/collections/tenant-satisfaction-measures
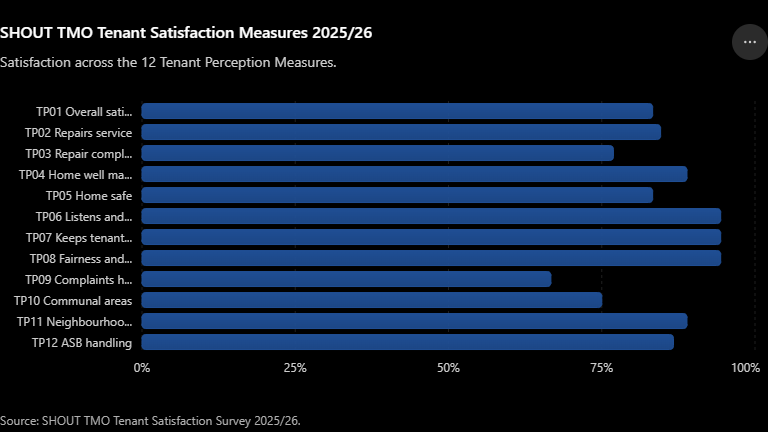
Our 2025/26 results show a positive overall picture.
83.3% Overall Satisfaction
More than eight out of ten respondents are satisfied with the overall service provided by SHOUT TMO.
Our strongest results relate to listening to tenants, keeping residents informed, fairness and respect, maintaining homes and neighbourhood management.
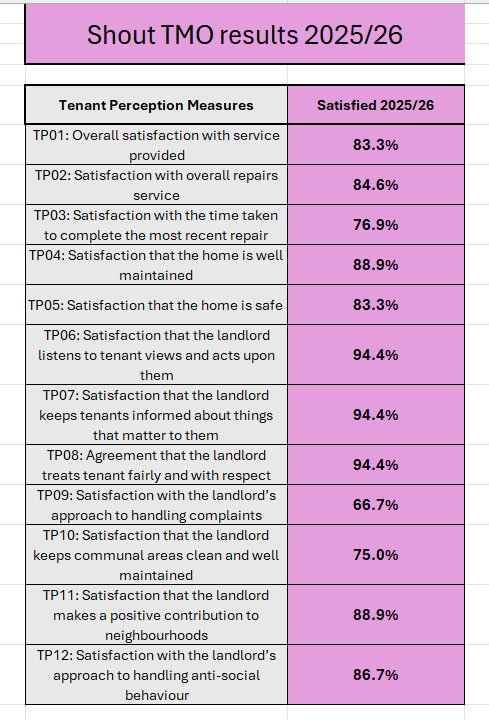
Our 2025/26 Results
| Code | Tenant Satisfaction Measure | Result |
|---|---|---|
| TP01 | Overall satisfaction | 83.3% |
| TP02 | Overall repairs service | 84.6% |
| TP03 | Time taken to complete most recent repair | 76.9% |
| TP04 | Home well maintained | 88.9% |
| TP05 | Home safe | 83.3% |
| TP06 | Listens to tenants and acts | 94.4% |
| TP07 | Keeps tenants informed | 94.4% |
| TP08 | Fairness and respect | 94.4% |
| TP09 | Complaints handling | 66.7% |
| TP10 | Communal areas | 75.0% |
| TP11 | Positive neighbourhood contribution | 88.9% |
| TP12 | Handling anti-social behaviour | 86.7% |
How Have Our Results Changed?
Comparing the 2025/26 results with our previous survey helps us understand whether tenants are experiencing improvements.
SHOUT’s published 2024/25 results can be independently checked here:
https://shouttmo.co.uk/result-of-tenant-satisfaction-survey-2024-25/
| Measure | 2024/25 | 2025/26 | Change |
|---|---|---|---|
| Overall satisfaction | 81.8% | 83.3% | +1.5pp |
| Repairs service | 92.9% | 84.6% | -8.3pp |
| Repair completion time | 92.9% | 76.9% | -16.0pp |
| Home well maintained | 81.8% | 88.9% | +7.1pp |
| Home safe | 77.3% | 83.3% | +6.0pp |
| Listens and acts | 81.8% | 94.4% | +12.6pp |
| Keeps tenants informed | 72.7% | 94.4% | +21.7pp |
| Fairness and respect | 100.0% | 94.4% | -5.6pp |
| Complaints | 50.0% | 66.7% | +16.7pp |
| Communal areas | 60.0% | 75.0% | +15.0pp |
| Neighbourhood contribution | 77.3% | 88.9% | +11.6pp |
| ASB handling | 50.0% | 86.7% | +36.7pp |
Nine of our twelve perception measures improved.
Particularly encouraging is the improvement in communication, complaints handling and communal areas, because these were among the areas SHOUT identified for attention following the previous survey.
Local Benchmark
How Does SHOUT Compare Locally?
SHOUT manages 98 council-owned homes.
Manchester City Council identifies SHOUT separately within its housing-management arrangements and explains how the performance of its different managing agents contributes to the overall parent-landlord result.
Manchester City Council Housing — TSM information:
https://www.mcchousingservices.co.uk/about-us/tenant-satisfaction-measures/
For additional context we have compared SHOUT with several separately managed housing services in Manchester and Greater Manchester that publish their own satisfaction results.
Local Overall Satisfaction Benchmark
| Position | Organisation | Overall Satisfaction |
|---|---|---|
| 1 | Miles Platting | 94.0% |
| 2 | S4B Brunswick | 90.1% |
| 3 | Grove Village | 89.0% |
| 4 | Stockport Homes | 88.0% |
| 5 | SHOUT TMO | 83.3% |
Sources
Miles Platting:
https://www.milesplatting.co.uk/information-article/miles-platting-tenant-satisfaction-survey-results-2025/
S4B Brunswick:
https://s4bmanchester.co.uk/about-us/tsm-tenant-satisfaction-measures/
Grove Village:
https://www.yourhousinggroup.co.uk/about-us/performance-and-transparency/grove-village-tsms/
Stockport Homes:
https://www.stockporthomes.org/about-us/our-performance/tenant-satisfaction-measures/tenant-satisfaction-measures-year-end-2026/
What Does the Local Comparison Tell Us?
SHOUT performs particularly strongly in tenant voice.
Our 94.4% listening-and-acting result compares very positively with the wider benchmark.
However, locally managed services such as Miles Platting achieve particularly strong repairs performance.
That provides important learning for SHOUT.
Parent Authority Benchmark
SHOUT Compared with Selected Council Landlords
We have also compared SHOUT with four English council landlords:
Manchester City Council
City of Wolverhampton Council
Westminster City Council
Oxford City Council
Parent Authority Comparison
| TSM | SHOUT | Manchester | Wolverhampton | Westminster | Oxford |
|---|---|---|---|---|---|
| Overall satisfaction | 83.3% | 64.0% | 67.5% | 64.2% | 80.4% |
| Repairs | 84.6% | 69.0% | 76.3% | 63.2% | 82.0% |
| Repair completion | 76.9% | 67.0% | 75.2% | 62.6% | 78.7% |
| Home well maintained | 88.9% | 66.0% | 70.8% | 67.8% | 77.9% |
| Home safe | 83.3% | 68.0% | 76.2% | 70.6% | 80.9% |
| Listens and acts | 94.4% | 58.0% | 57.5% | 62.4% | 70.7% |
| Keeps informed | 94.4% | 64.0% | 71.2% | 80.4% | 82.5% |
| Fairness and respect | 94.4% | 73.0% | 71.1% | 77.0% | 84.5% |
| Complaints | 66.7% | 36.0% | 32.3% | 30.7% | 31.5% |
| Communal areas | 75.0% | 62.0% | 66.8% | 76.2% | 75.5% |
| Neighbourhood contribution | 88.9% | 58.0% | 62.0% | 78.6% | 71.3% |
| ASB | 86.7% | 56.0% | 53.6% | 64.0% | 65.3% |
Sources
Manchester City Council:
https://www.mcchousingservices.co.uk/about-us/tenant-satisfaction-measures/
City of Wolverhampton Council:
https://www.wolverhampton.gov.uk/housing/housing-strategy-performance-and-policy/tenant-satisfaction-measures
Westminster City Council:
https://www.westminster.gov.uk/housing/tenant-satisfaction-measures
Oxford City Council:
https://www.oxford.gov.uk/landlord-performance/tenant-satisfaction-measures-25-26
SHOUT’s strongest comparative advantages are again found in listening, communication, fairness, complaints and neighbourhood management.
Oxford provides a useful stronger-performing council benchmark and slightly outperforms SHOUT on repair completion time.
National Benchmark
England, Scotland and Wales
England, Scotland and Wales operate different social-housing regulatory frameworks.
The comparison below should therefore be understood as national context rather than a directly equivalent UK league table.
National Overall Satisfaction Context
| Benchmark | Overall Satisfaction |
|---|---|
| Scotland — all social landlords | 87.0% |
| SHOUT TMO | 83.3% |
| Scotland — council landlords | 81.0% |
| England — median registered landlord | 71.8% |
| England — median local authority | 68.5% |
| Wales | Different national reporting framework |
England
The Regulator of Social Housing’s latest complete national TSM publication is the 2024/25 dataset.
Official national publication:
https://www.gov.uk/government/statistics/tenant-satisfaction-measures-202425
Detailed national headline report:
https://www.gov.uk/government/statistics/tenant-satisfaction-measures-202425/tenant-satisfaction-measures-202425-headline-report
SHOUT’s 83.3% overall satisfaction is:
- 11.5 percentage points above the English landlord median
- 14.8 points above the English council median
SHOUT vs England Median
| Measure | SHOUT | England Median | Difference |
|---|---|---|---|
| Overall | 83.3% | 71.8% | +11.5pp |
| Repairs | 84.6% | 73.6% | +11.0pp |
| Repair completion | 76.9% | 69.5% | +7.4pp |
| Home maintained | 88.9% | 71.9% | +17.0pp |
| Home safe | 83.3% | 77.6% | +5.7pp |
| Listens and acts | 94.4% | 61.6% | +32.8pp |
| Keeps informed | 94.4% | 72.0% | +22.4pp |
| Fairness and respect | 94.4% | 77.9% | +16.5pp |
| Complaints | 66.7% | 35.5% | +31.2pp |
| Communal areas | 75.0% | 66.7% | +8.3pp |
| Neighbourhood | 88.9% | 64.6% | +24.3pp |
| ASB | 86.7% | 59.5% | +27.2pp |
Scotland
Scotland operates through the Scottish Social Housing Charter.
The Scottish Housing Regulator reports 87% overall satisfaction across Scottish social landlords and 81% for local-authority landlords.
Official Scottish Housing Regulator source:
https://www.housingregulator.gov.scot/landlord-performance/national-reports/national-reports-on-the-scottish-social-housing-charter/national-report-on-the-scottish-social-housing-charter-2024-2025/
Wales
Wales uses its own standardised tenant-satisfaction framework rather than England’s TSM framework.
Welsh Government — Social Landlords Tenant Satisfaction Survey 2025:
https://www.gov.wales/social-landlords-tenant-satisfaction-survey-2025-html
Because the methodology is different, SHOUT does not manufacture a direct TP01–TP12 comparison with Wales.
Independent Complaints Context
Housing Ombudsman
Tenant surveys tell us how residents perceive services.
The Housing Ombudsman provides a second, independent source of evidence about complaint outcomes.
Manchester City Council’s landlord record is published here:
https://www.housing-ombudsman.org.uk/landlords/manchester-city-council/
Its published 2024/25 landlord performance report is available here:
https://www.housing-ombudsman.org.uk/app/uploads/2025/09/Landlord-Report-Manchester-City-Council.pdf
The Ombudsman’s wider landlord-performance database is available here:
https://www.housing-ombudsman.org.uk/landlords/
SHOUT uses Ombudsman evidence as additional context rather than relying solely on satisfaction percentages.
Our Response
Repairs — Understanding the Result
Our 2025/26 results show:
84.6% overall repairs satisfaction
and
76.9% satisfaction with repair completion time.
The fall in repair completion satisfaction requires important context.
During the survey period, SHOUT did not directly control the operational delivery of responsive repairs.
SHOUT-managed properties were serviced through the wider Manchester City Council arrangements using Equans.
SHOUT could report, monitor, pursue and escalate repairs, but contractor deployment, appointments and completion remained outside SHOUT’s full operational control.
SHOUT’s internal review identified significant delays, including approximately 20 jobs delayed, on hold or progressing slowly, together with disruption associated with changes within Equans.
Taking Repairs Back Under Local Control
The SHOUT TMO Board has approved a proposal to seek the return of repairs-management responsibilities.
SHOUT is now in detailed discussions with Manchester City Council.
The proposed approach is intended to provide:
- faster local intervention
- closer monitoring of outstanding repairs
- improved contractor accountability
- better property oversight
- stronger resident communication
- clearer escalation
- a more locally accountable service
SHOUT’s documented proposal identifies faster response times, improved accountability, better property oversight and more resident-focused service delivery as expected benefits.
The national Right to Manage framework itself recognises functions including receiving and recording repairs, inspections, managing repair programmes and letting repair contracts as potential TMO management functions.
Our principle is simple:
If SHOUT is accountable to tenants for the outcome, we want sufficient operational control to deliver the best possible outcome.
My SHOUT TMO
Building the Infrastructure for Better Services
SHOUT has developed its own integrated customer and housing-management platform:
My SHOUT TMO
The resident-facing platform is designed to support:
- contacts and service requests
- repair reporting
- repair tracking
- complaints
- ASB reporting
- case updates
- communication histories
Behind those resident services, My SHOUT TMO is designed to integrate much wider operational functions including:
- tenancy management
- property management
- repairs
- complaints
- ASB
- allocations and applications
- applicant selection and vetting
- governance
- Board meetings and minutes
- volunteering
- partnership management
- contractor and contract management
- HR
- accounts
- budgeting
- TMO allowances
- finance
- administration
- estate management
- performance monitoring
- workflows and approvals
SHOUT’s internal digital-transformation programme identifies tenancy management, repairs, governance, finance, administration, estate management and performance monitoring as core elements of the platform.
AI-Assisted Automation
SHOUT’s longer-term ambition is to automate up to 95% of suitable routine administrative and operational workflows.
AI-assisted automation is intended to support:
- workflow routing
- reminders
- follow-ups
- document generation
- case monitoring
- task allocation
- performance information
- identifying overdue actions
- routine administrative processes
Appropriate human oversight will remain in place where decisions affect tenants, applicants, staff, governance or contractual relationships.
The aim is not technology for its own sake.
The aim is a service that is:
faster
more seamless
more accountable
more consistent
more effective
Complaints — Our Response
Satisfaction has improved from:
50% in 2024/25
to
66.7% in 2025/26
Previous result:
https://shouttmo.co.uk/result-of-tenant-satisfaction-survey-2024-25/
My SHOUT TMO will support clearer complaint ownership, deadlines, correspondence histories, escalation stages and outcome recording.
Housing Ombudsman information:
https://www.housing-ombudsman.org.uk/
Communication — Our Response
Satisfaction with keeping residents informed increased from:
72.7% → 94.4%
Previous result:
https://shouttmo.co.uk/result-of-tenant-satisfaction-survey-2024-25/
My SHOUT TMO is intended to make it easier for residents to check requests and receive updates while preserving direct contact with SHOUT staff.
Digital access should strengthen personal service — not replace it.
Our Priorities for 2026/27
Our evidence and benchmarking point to several priorities:
Repairs: seek greater operational control and improve repair completion times.
My SHOUT TMO: continue implementing the integrated resident and management platform.
Complaints: build on the improvement from 50% to 66.7%.
Communication: protect the strong 94.4% satisfaction level.
Tenant voice: maintain the 94.4% listening-and-acting result and connect resident feedback more clearly with Board decisions.
Neighbourhoods: maintain strong ASB and neighbourhood results while improving communal-area standards.
Performance: use integrated information and automation to strengthen Board oversight and accountability.
A Note About Benchmarking
SHOUT manages just 98 homes.
The organisations used for comparison differ substantially in scale, geography, housing stock, demographics, survey method and number of survey responses.
England, Scotland and Wales also operate different regulatory systems.
These figures should therefore be understood as benchmarks for transparency and learning rather than a definitive ranking of landlord quality.
Official English national TSM guidance and results:
https://www.gov.uk/government/collections/tenant-satisfaction-measures
Thank You
Thank you to everyone who took part in our 2025/26 Tenant Satisfaction Survey.
The results help us understand:
where we are performing well
where tenants expect more
which organisations we can learn from
and
what changes SHOUT should make next.
Our ambition is to combine the strengths of a small, tenant-led, locally accountable organisation with modern technology, greater operational control and strong governance.

Comments are closed